
A practical look at Omegawave, HRV, CNS readiness, metabolic readiness, and why one great score still does not prove causation
Note: The Oura screenshots included later in this article are historical weekly context from roughly three days before the Omegawave assessment. They are not same-day measurements and should not be treated as a direct pre/post comparison.
The setup
I like physiological data, but I like it most when it can answer a useful question. On this day, I ran a Shiftwave DAS Optimizer session and then completed an Omegawave assessment. The result was an unusually strong readiness profile across cardiac, autonomic, metabolic, and central nervous system measures.
The tempting conclusion is obvious: Shiftwave worked. Maybe. But that conclusion moves faster than the data. A single post-session measurement can show what state I was in after the intervention; it cannot tell us how much of that state was caused by the intervention.
Overall readiness: essentially a full green light
Omegawave reported an Overall Readiness score of 6.58 out of 7 and classified the state as Optimal. The assessment described the body as calm and recovered, and the training recommendations were correspondingly permissive.
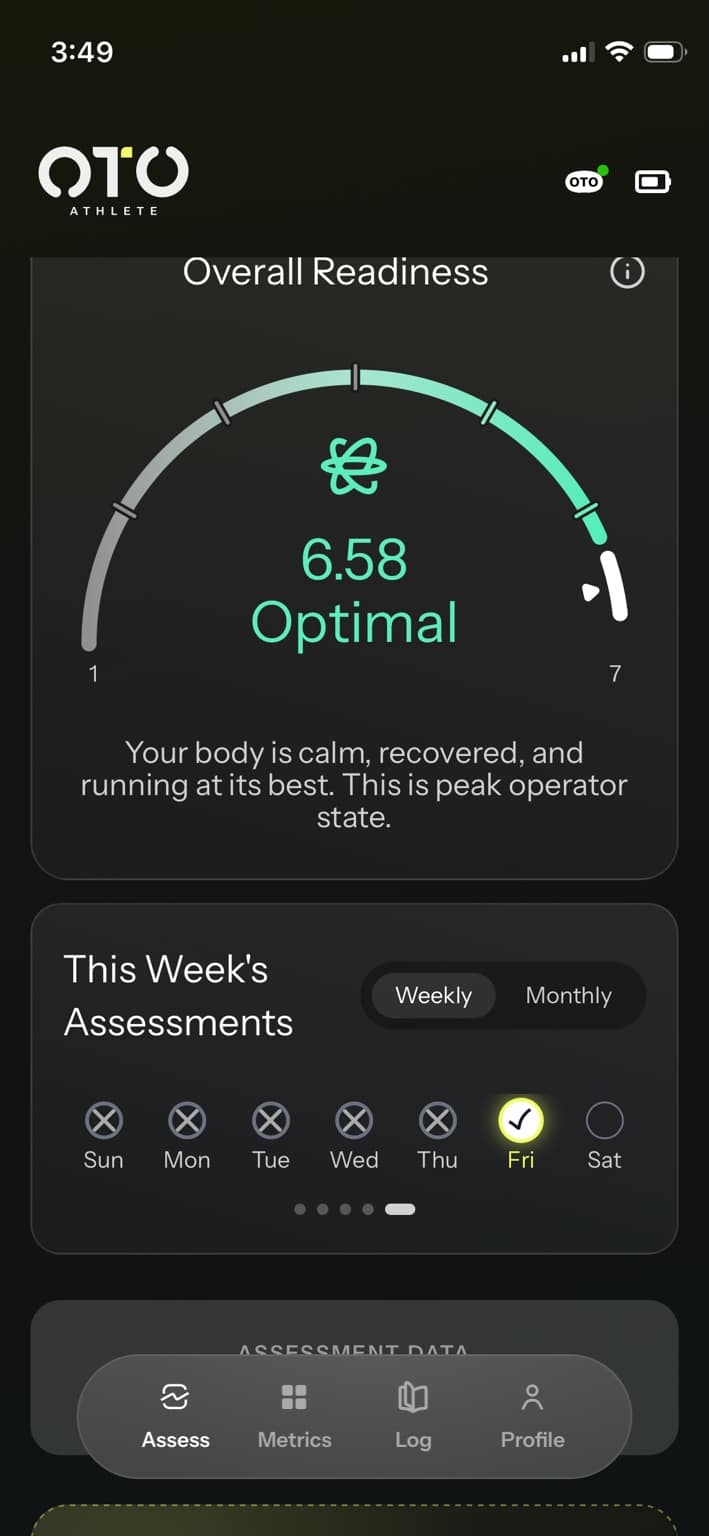
Figure 1. Omegawave Overall Readiness after the DAS Optimizer session: 6.58/7, classified as Optimal.
All four windows of trainability were open
The assessment showed favorable trainability for endurance, speed and power, strength, and coordination/skills. That does not mean I should automatically try to destroy myself in all four domains before dinner. It means the system was not identifying an obvious readiness-based reason to avoid the quality I had planned to train.
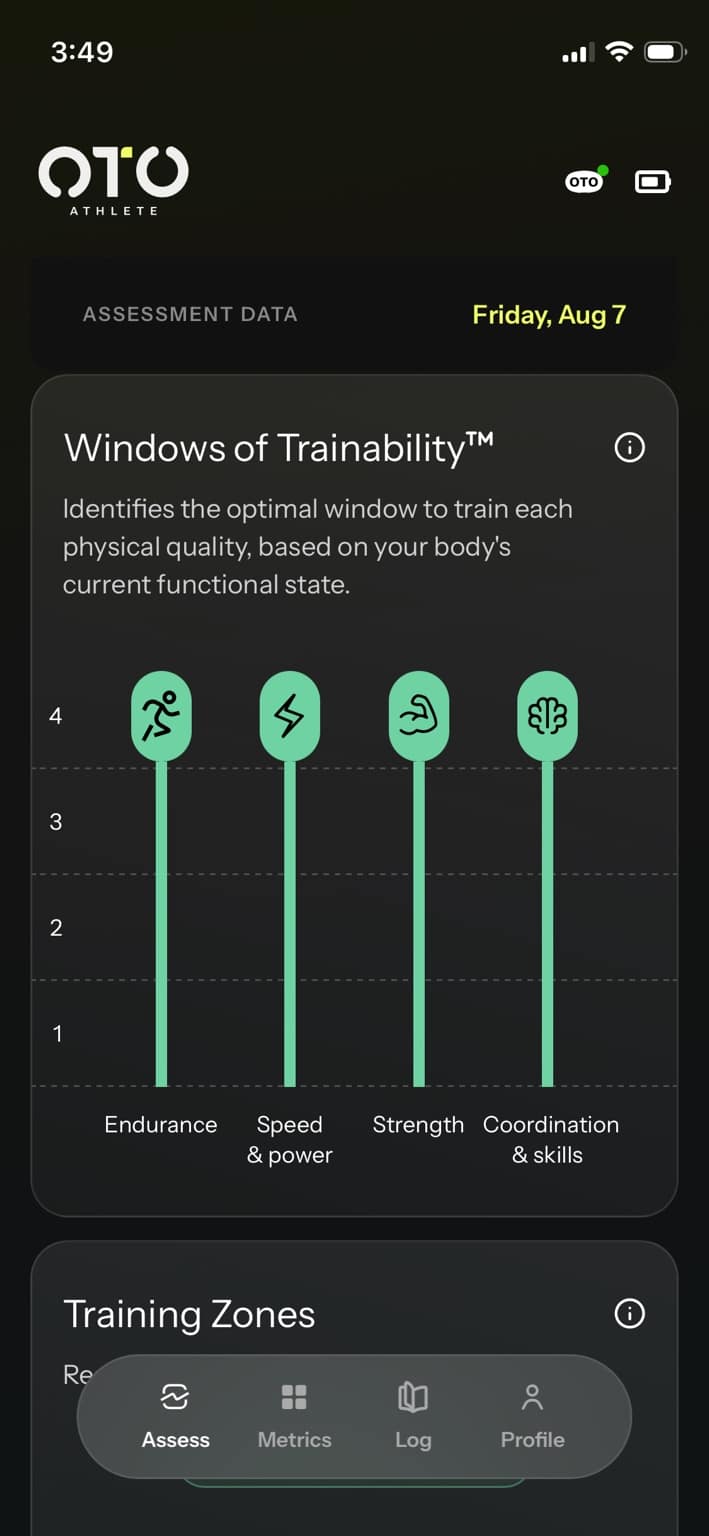
Figure 2. Windows of Trainability: endurance, speed/power, strength, and coordination/skills were all favorable.
Cardiac and autonomic data
The cardiac side of the assessment was also strong. Resting heart rate during the Omegawave measurement was 46 bpm. Parasympathetic and sympathetic indicators were both classified as Optimal, while Cardiac Stress was rated Very Good.
Time-domain HRV metrics were SDNN 57.1 ms, RMSSD 58.5 ms, and SDSD 74.4 ms. Frequency-domain values were LF 859.2 ms², HF 410.3 ms², LF/HF 2.09, and total power 1556.2 ms². The app also reported CRI 0.22 as Optimal and AMo 29%.
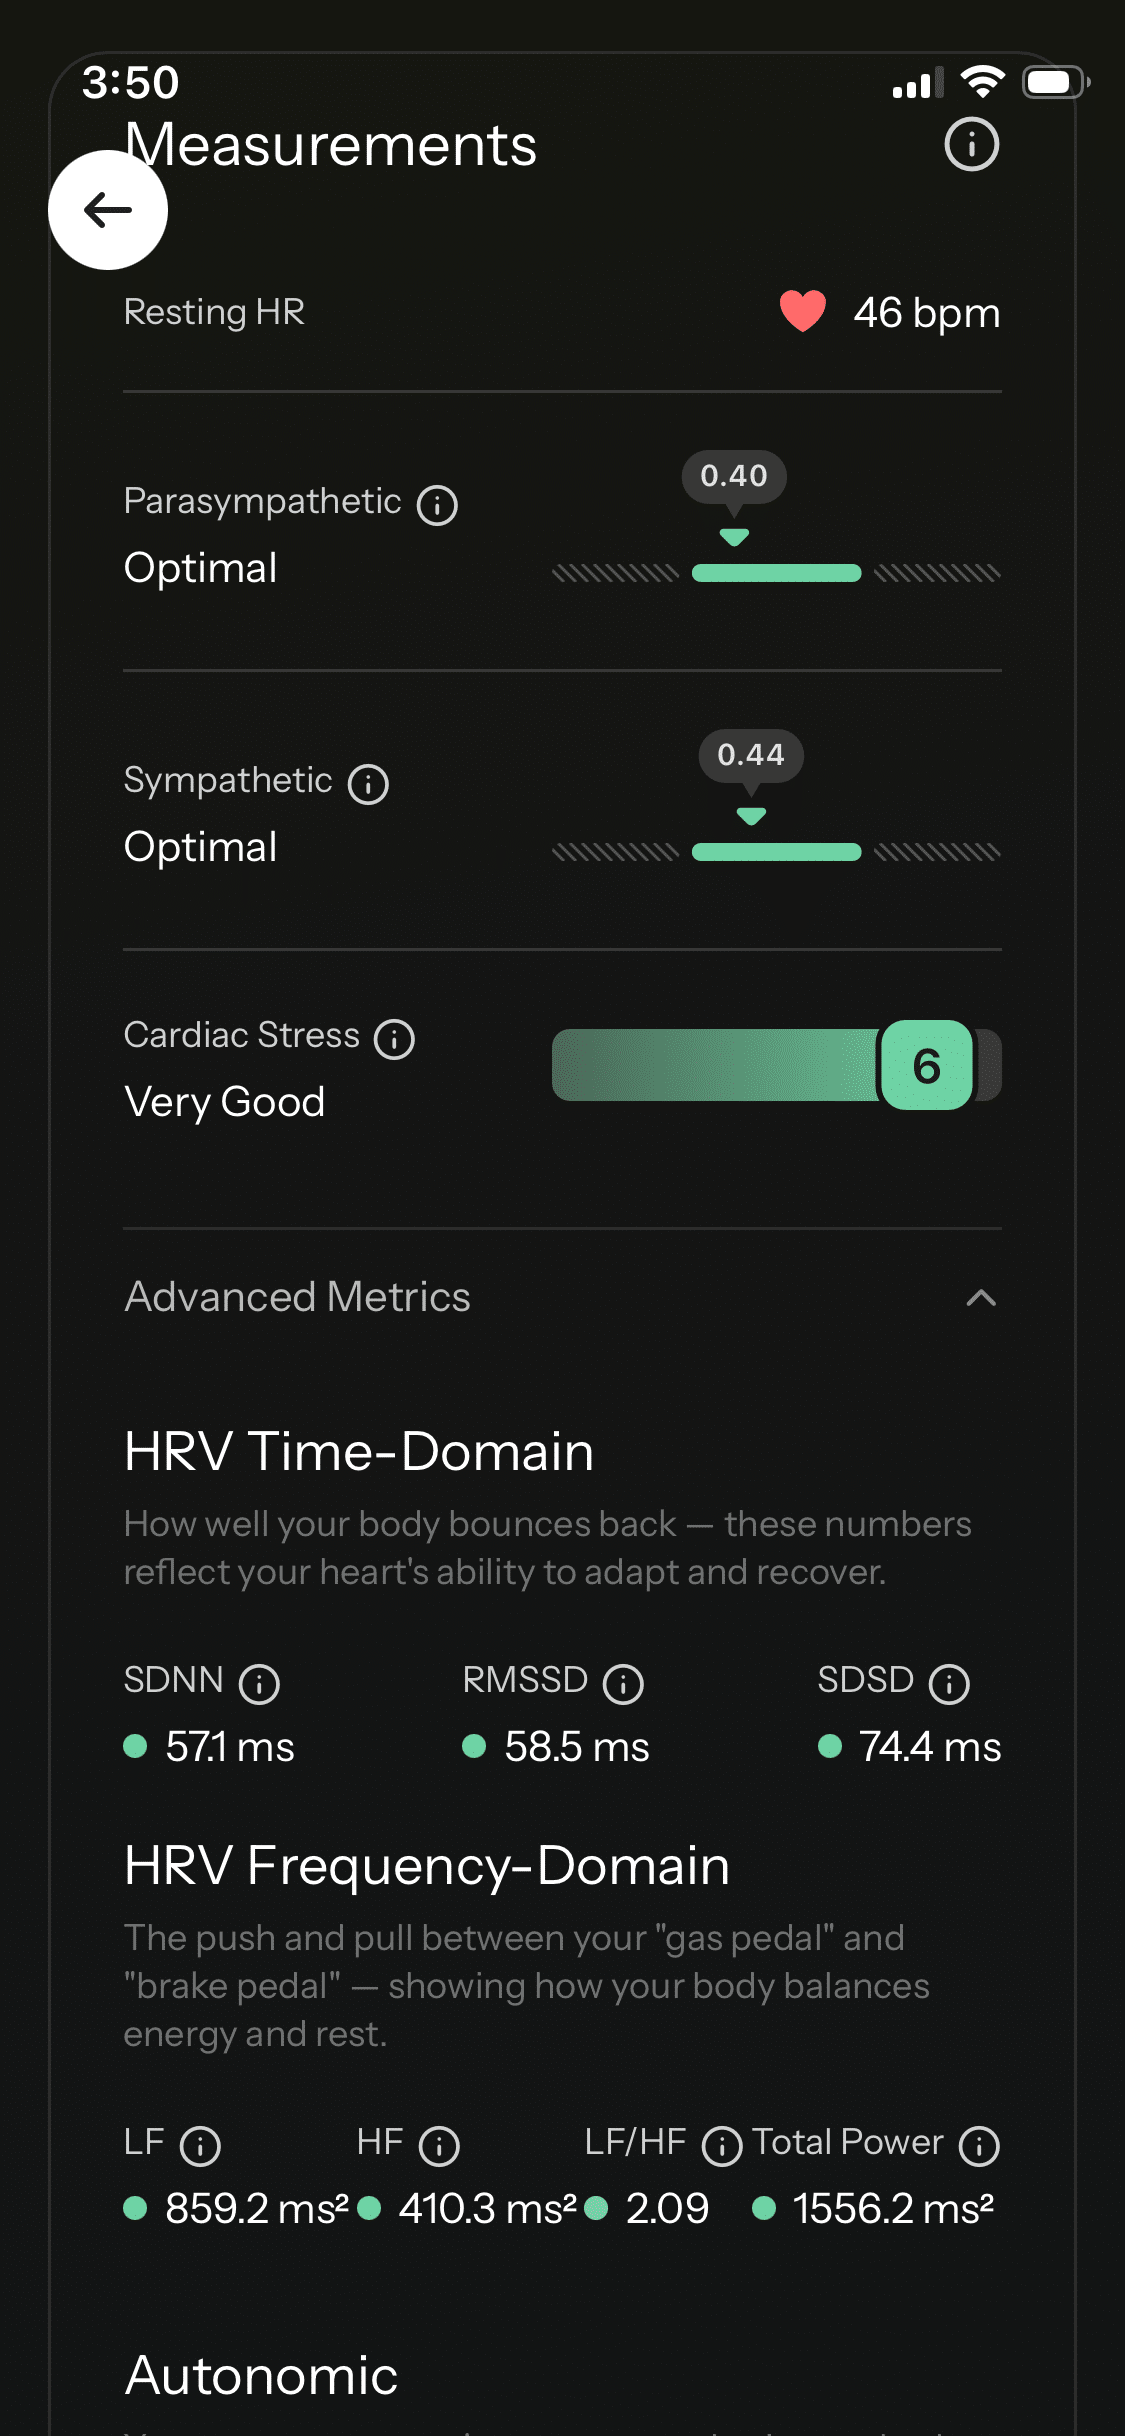
Figure 3. Omegawave cardiac and HRV metrics. The useful signal here is the overall pattern rather than trying to turn any single HRV number into a magic readiness oracle.
A key point with HRV: higher is not automatically better. Context and the individual’s baseline matter. An unusually elevated HRV can sometimes occur alongside fatigue or parasympathetic hyperactivity. What made this assessment encouraging was the combination of HRV, low cardiac stress, favorable autonomic classifications, and the broader readiness profile.
The CNS data were especially interesting
The central nervous system component is particularly relevant when assessing whether an acute downregulation intervention altered the current functional state. Omegawave reported a DC Potential of 21.25 mV, a Deep Rest curve shape, an Optimal DC curve, a stabilization time of 163 seconds classified as Fast, a stabilization grade of 0.71 (Modest Reduction), and tension/exhaustion of -0.18.
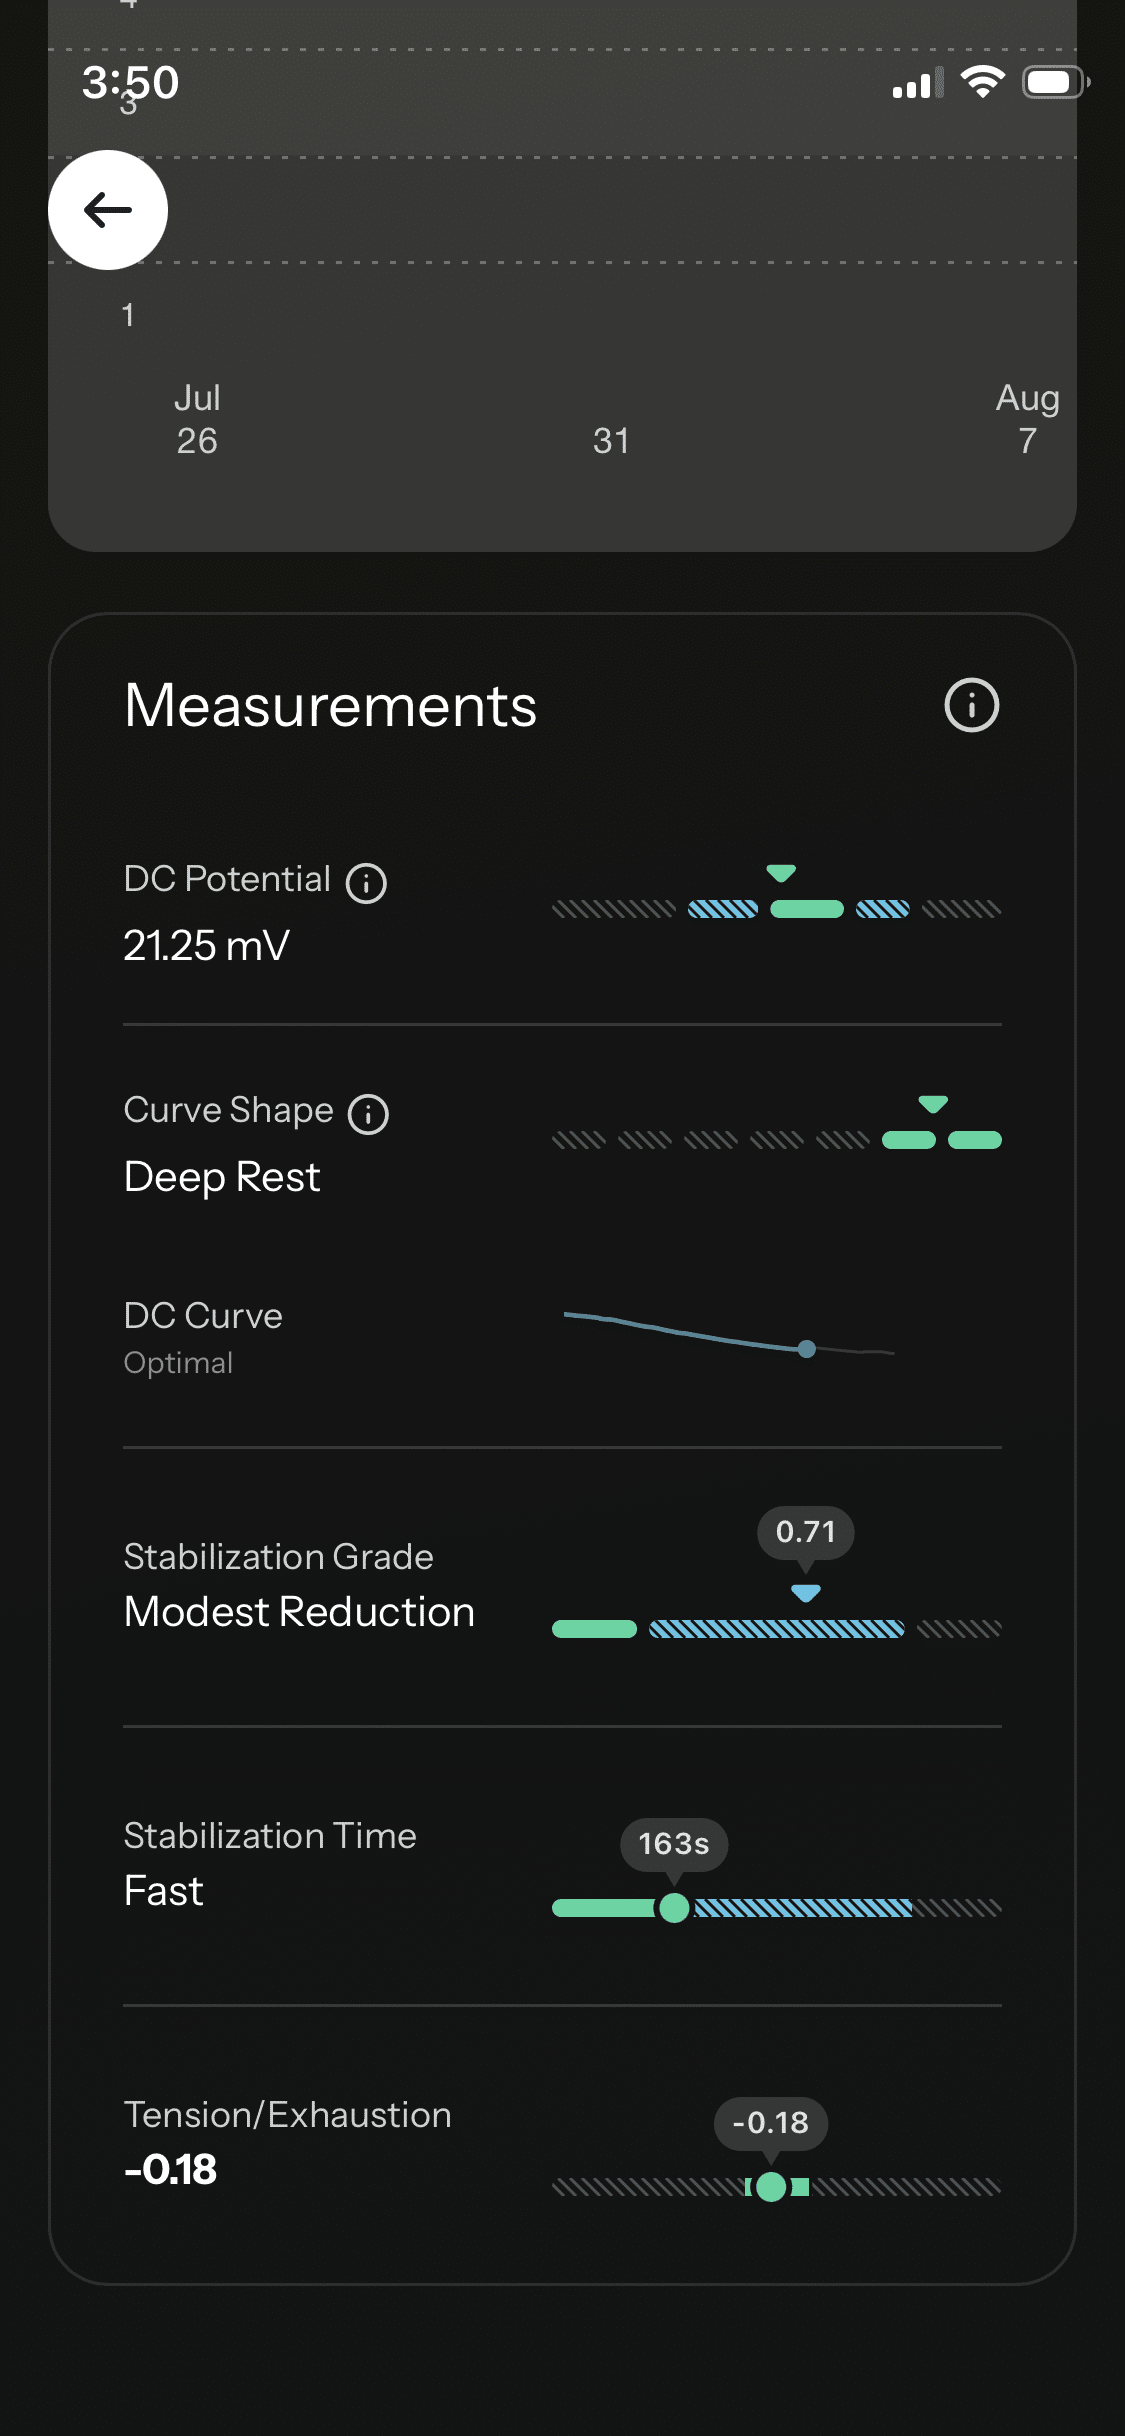
Figure 4. Omegawave DC-potential/CNS measurements after Shiftwave. The combination of Deep Rest and fast stabilization was one of the more interesting parts of the assessment.
That is directionally what I would hope to see after an intervention intended to move the nervous system toward a more recovered, regulated state. It is still an association, not proof that Shiftwave created the change.
Metabolic readiness was moving in the right direction
The metabolic-readiness trend had moved from approximately 4 on July 26 and July 31 to approximately 5 on August 7. The assessment displayed a raw MRI of 214, Aerobic Readiness of 108, and Anaerobic Readiness of 134.
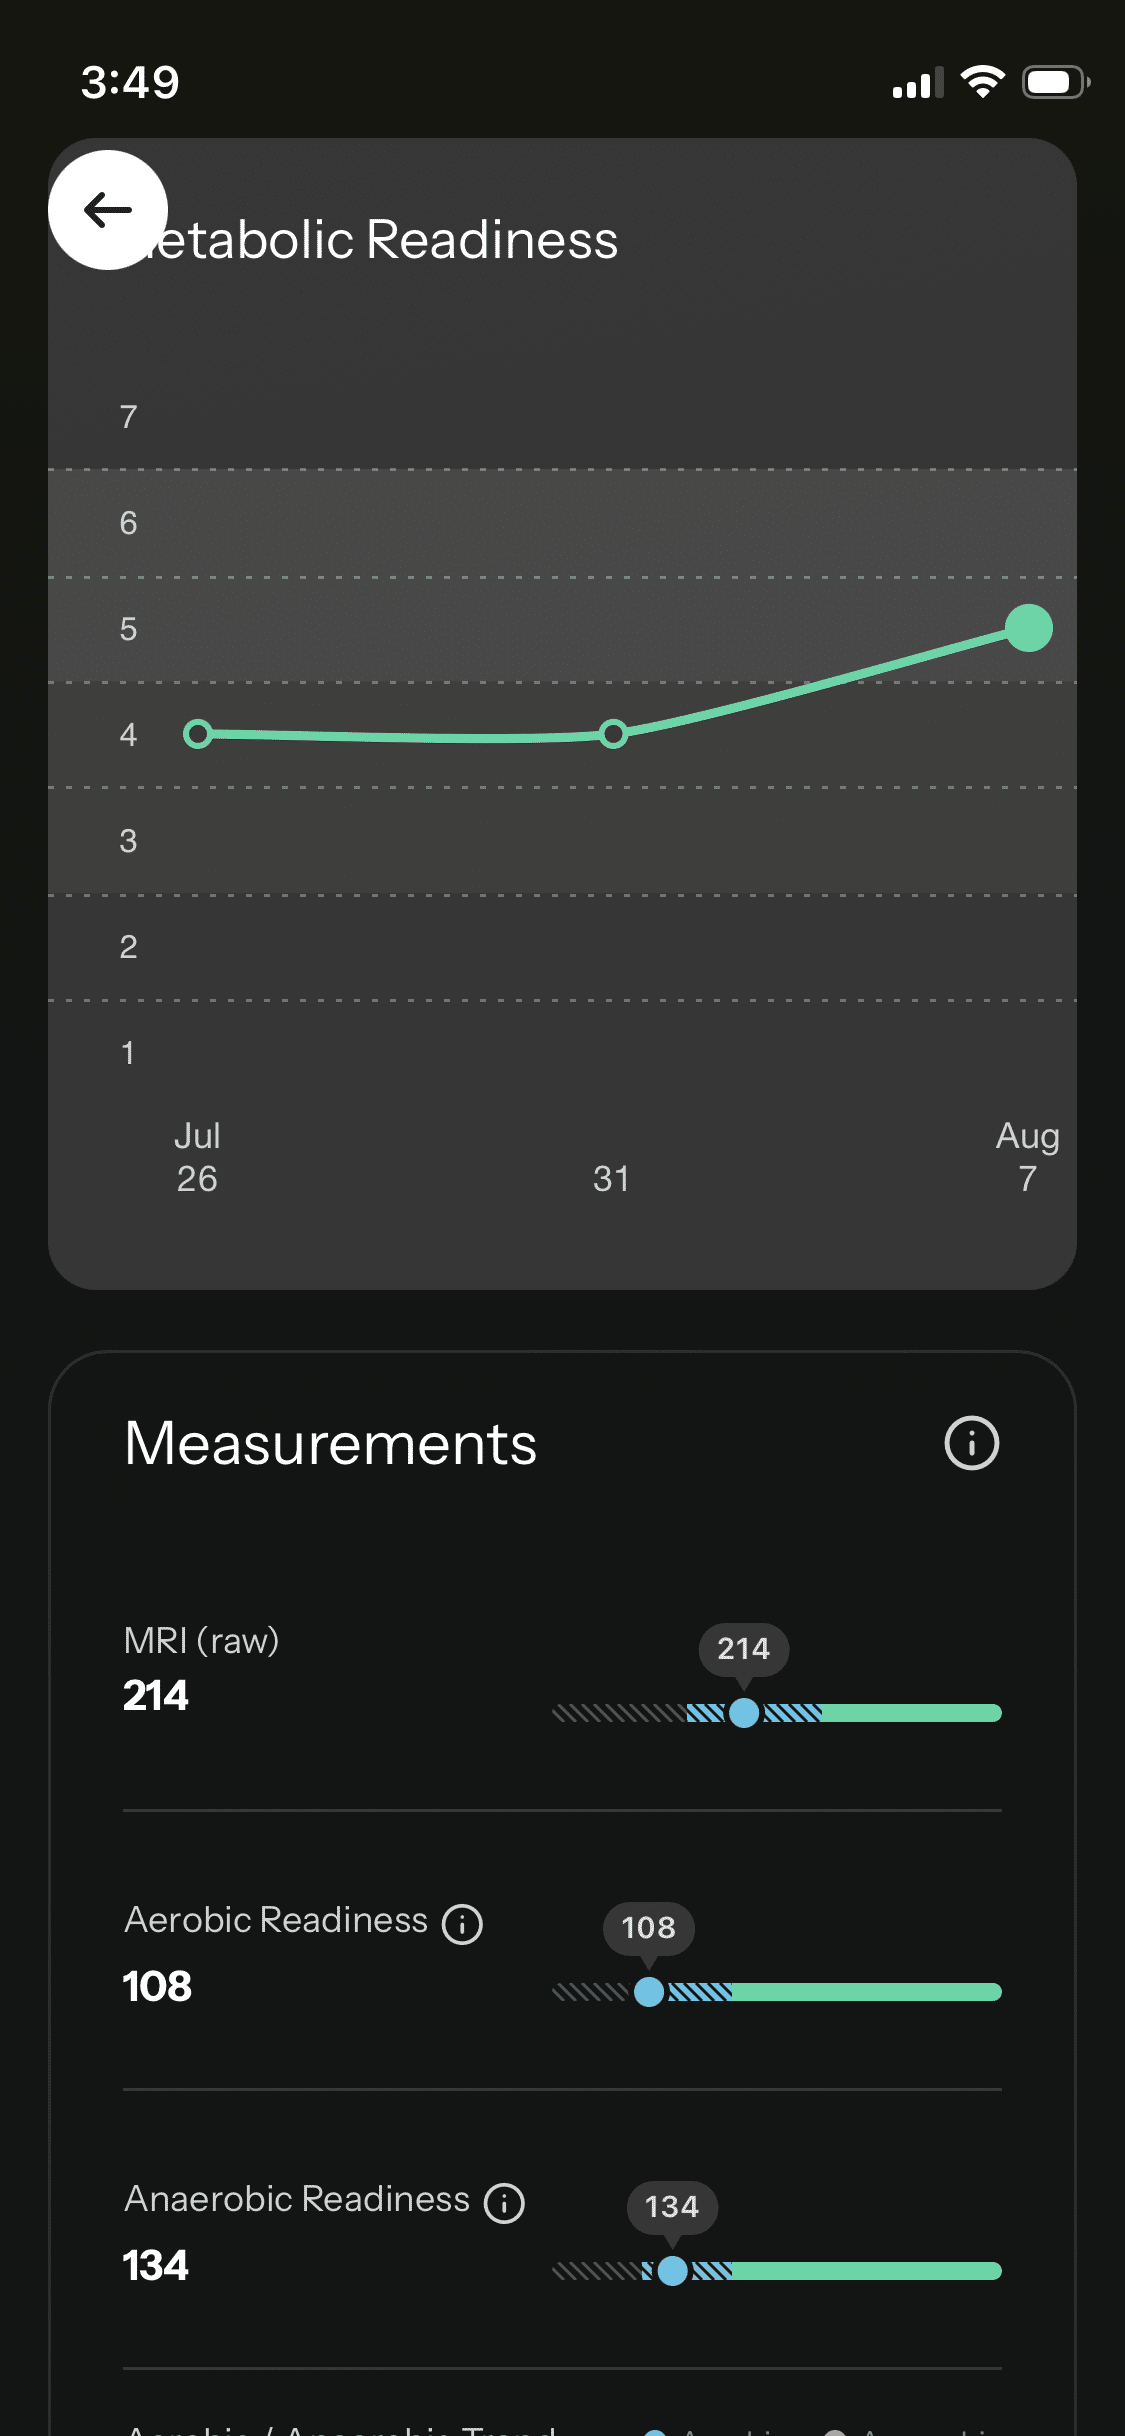
Figure 5. Metabolic Readiness trend and component measurements.
Training zones: Omegawave was not asking for an easy day
With a measured resting heart rate of 46 bpm, Omegawave cleared training through Zone 6. The displayed zones ranged from recuperation at 92-106 bpm through anaerobic development at 164-180 bpm.
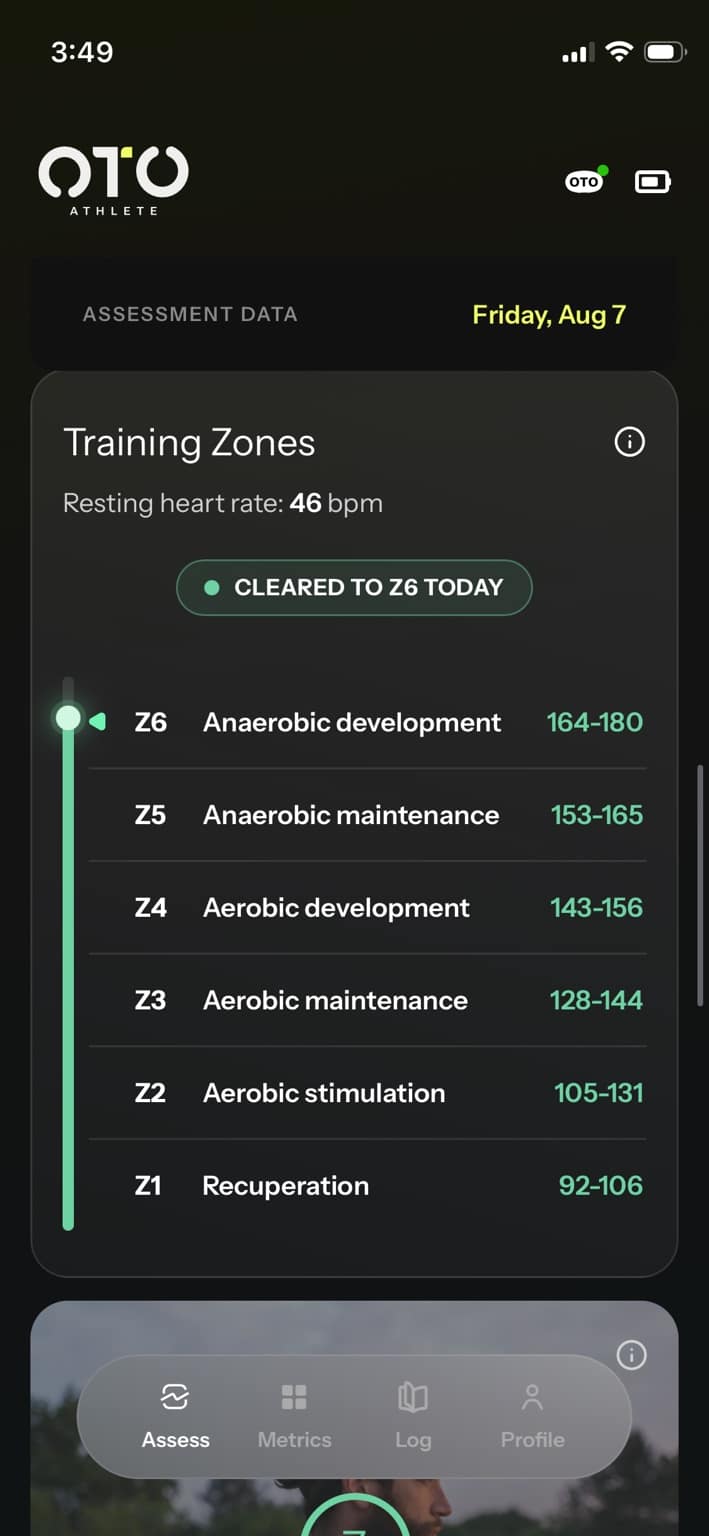
Figure 6. Omegawave training-zone recommendation for the assessment day.
For me, the practical interpretation is not ‘Omegawave says Z6, therefore smash yourself.’ It is that the physiological snapshot did not provide a compelling reason to downgrade a planned hard session. Performance, warm-up response, soreness, motivation, and the actual training plan still matter.
Where the Oura data fit – and where they do not
I also had Oura data from earlier in the week. This needs an important timestamp caveat: these screenshots were about three days before the Omegawave assessment. They provide background on the week’s autonomic pattern, not a same-day comparison.
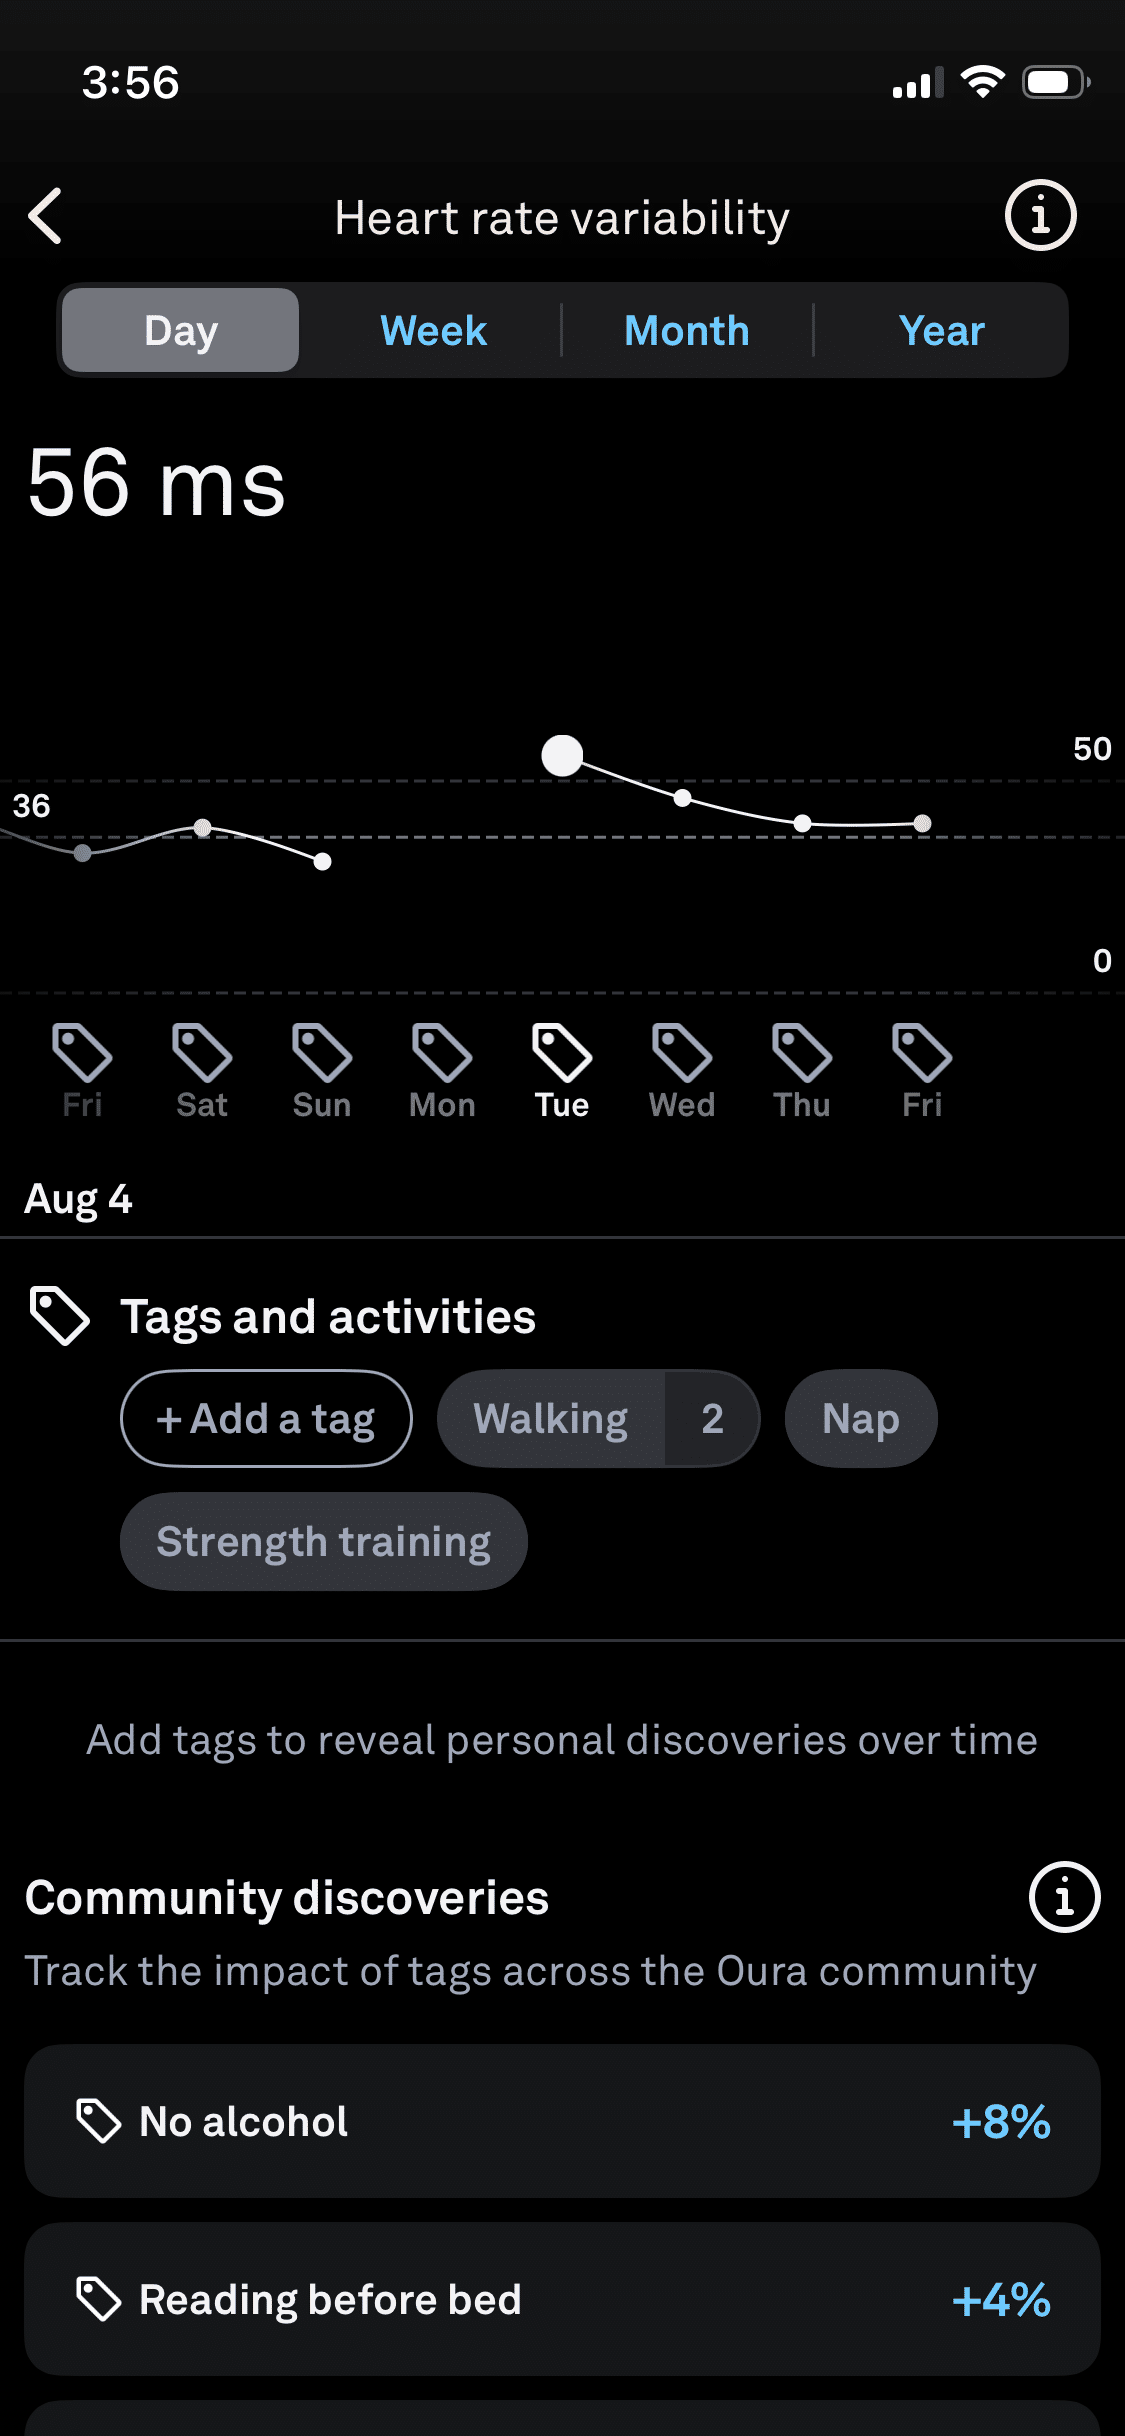
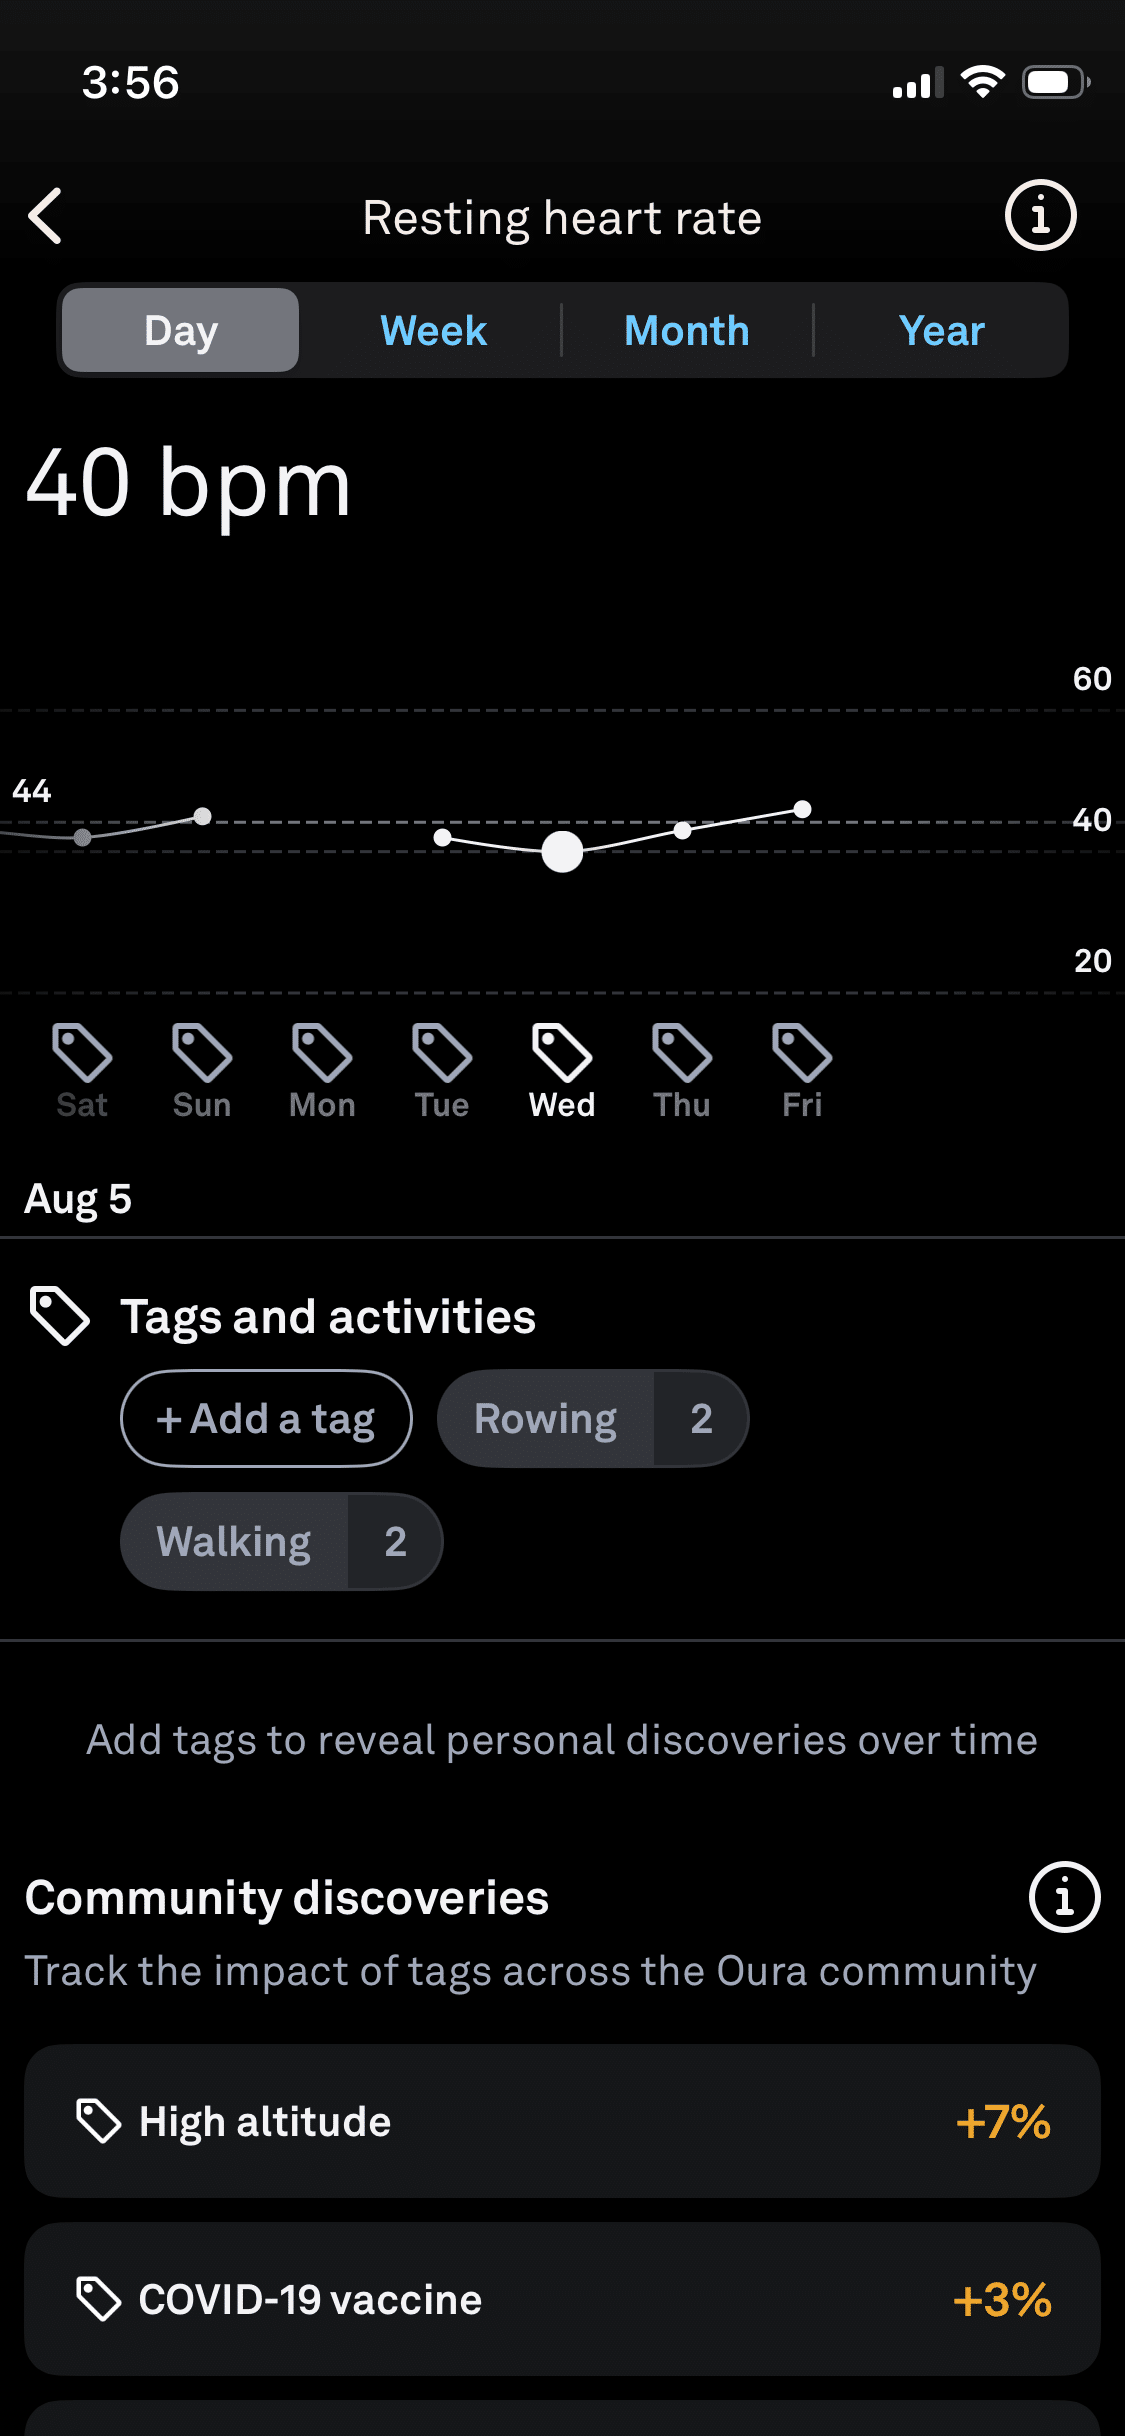
The earlier Oura HRV reading shown was 56 ms, with the graph suggesting a peak in the low-60-ms range earlier in the week before settling toward the mid-50s. Resting heart rate was 40 bpm on the displayed day, with surrounding values ranging from the high-30s to low-40s.
| Measure | Earlier Oura context | Later Omegawave assessment |
|---|---|---|
| HRV | 56 ms displayed | RMSSD 58.5 ms |
| Resting HR | 40 bpm displayed | 46 bpm |
| Timing | ~3 days earlier | Post-DAS Optimizer |
These values are broadly compatible but not interchangeable. Oura’s overnight measurements and Omegawave’s controlled spot assessment are collected under different conditions and answer somewhat different questions. The difference in resting heart rate is therefore not surprising.
 |
 |
|---|
Figure 7. Oura weekly context from several days before the Omegawave test: HRV (left) and resting heart rate (right). These are historical context, not post-Shiftwave measurements.
So, did the DAS Optimizer work?
The post-session state looked excellent. That is the strongest conclusion I can defend from this observation.
The data are consistent with the possibility that DAS Optimizer helped acutely: readiness was 6.58/7, the autonomic indicators were favorable, cardiac stress was very good, the CNS curve was classified as Deep Rest, stabilization was fast, and every trainability window was open. But there was no immediate pre-DAS Omegawave measurement shown here, and there was no randomized control condition. Baseline recovery, recent training, sleep, nutrition, measurement variability, expectation, and plain old day-to-day physiology can all contribute.
A better N=1 experiment
If I want to know whether DAS Optimizer reliably changes my physiology rather than merely producing a nice-looking screenshot, I need repeated measurements.
- Collect baseline Omegawave measurements under standardized conditions before Shiftwave.
- Run the same DAS Optimizer protocol at approximately the same time of day.
- Repeat Omegawave after a standardized interval.
- Include control days where I sit quietly for the same amount of time without Shiftwave.
- Track Overall Readiness, DC Potential, curve shape, stabilization time, RMSSD/SDNN, resting HR, and the relevant metabolic-readiness measures.
- Most importantly, record what happens in training: pace, power, load, repetitions, RPE, and whether the warm-up feels unusually good or bad.
- Use next-morning Oura data as a separate recovery outcome rather than pretending it is an acute post-session measure.
What would convince me?
A repeatable shift in the same direction across multiple sessions would be much more interesting than one monster readiness score. Better still would be a physiological change that predicts something I actually care about: improved performance at the same perceived effort, better repeatability of hard sessions, or improved recovery afterward.
That distinction matters. Wearables are useful when they improve decisions. They become expensive digital fortune cookies when we simply admire the green numbers.
Bottom line
This was an excellent readiness assessment after the Shiftwave DAS Optimizer session. Omegawave showed a near-maximal Overall Readiness score, favorable cardiac/autonomic status, strong CNS characteristics, improving metabolic readiness, open trainability windows, and clearance through the highest training zone displayed.
I would treat that as a green light for a demanding planned session – not as proof that Shiftwave caused the green light.
The next step is the fun part: turn the anecdote into a structured N=1 experiment and see whether the signal survives repeated testing.
Data notes
This article is an interpretation of personal wearable/readiness data and is not a validation study of Omegawave or Shiftwave. Device-derived metrics should be interpreted relative to individual baselines, measurement conditions, and actual performance rather than used as stand-alone medical or diagnostic measures.